NAVIGATION. This page is a subpage of In the News – Wildfire/Extreme Weather on the website Nova Scotia Forest Matters (www.nsforestmatters.ca)
From: Canada’s out-of-control wildfire crisis in six charts
By Barry Saxifrage in the National Observer, Sep 3, 2025:
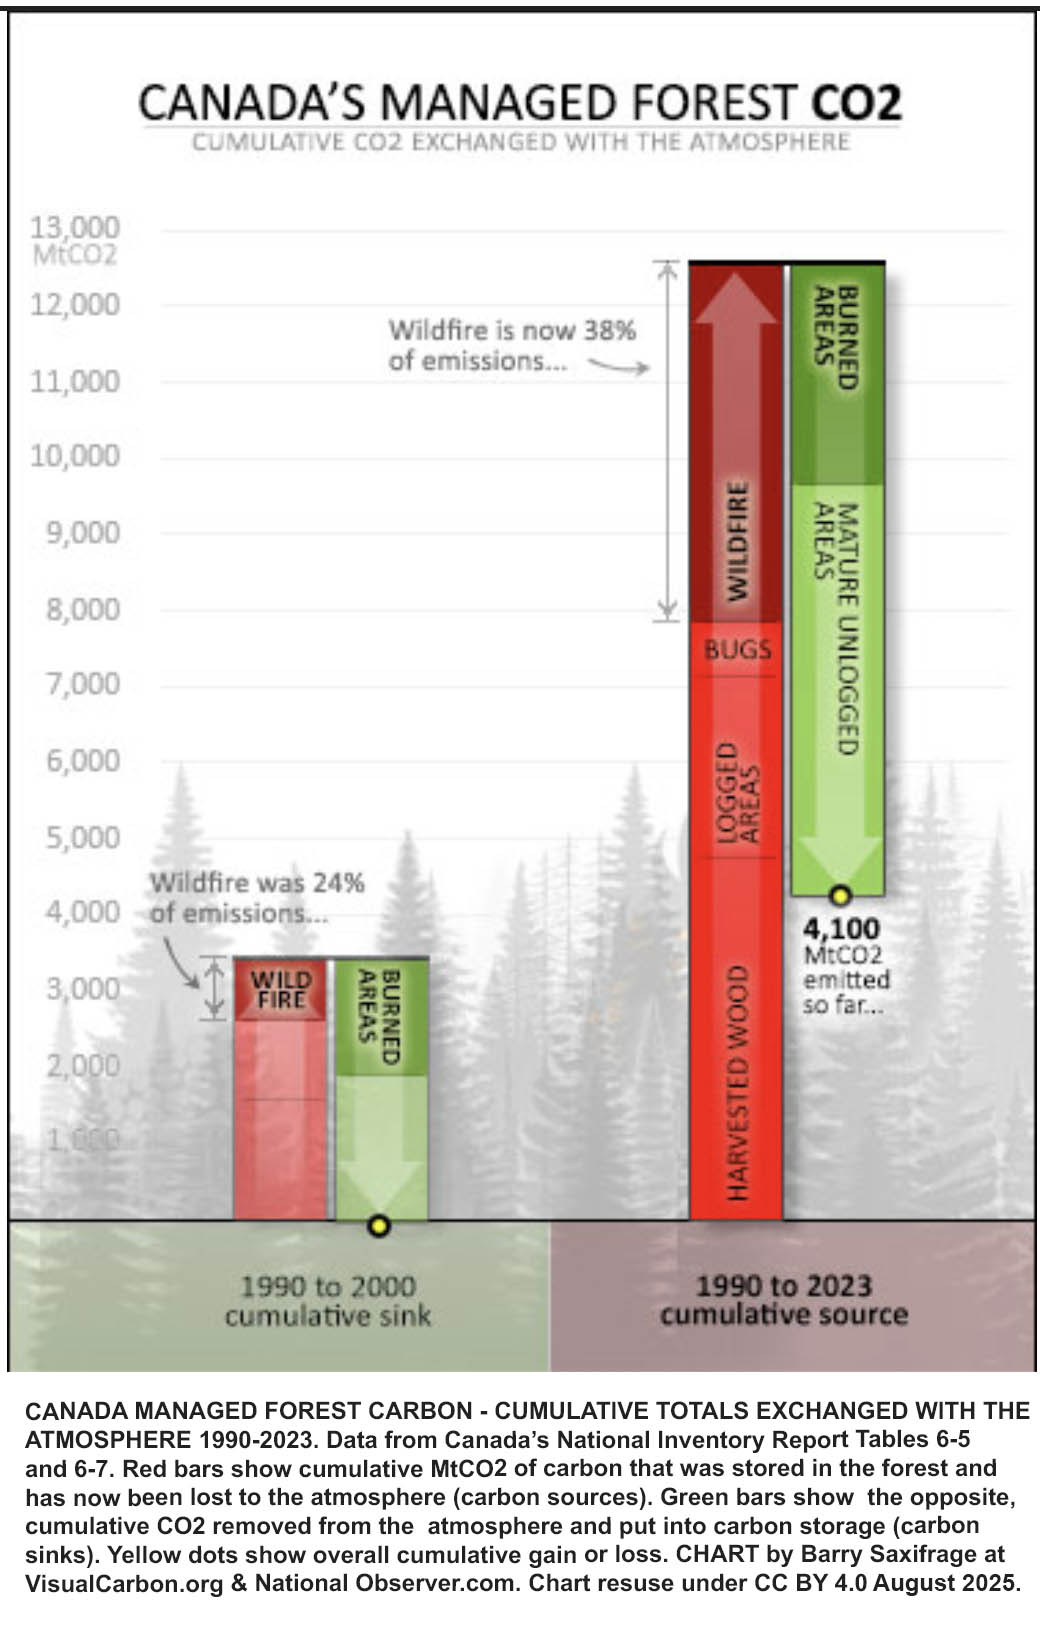
From the text: “These forest carbon losses are new. During the 1990s, Canada’s managed forest was a small overall carbon sink. This is shown by the shorter bars I’ve added to the left of the chart. This comparison also lets you see the rising impact of wildfire. Back in the 1990s, wildfires emitted one quarter of forest carbon emissions. That share had risen to more than a third by 2023. And we know from satellite data that this has jumped even higher with another billion tonnes of CO2 emitted in the last two years. Another wildfire change shown on the chart is the amount of carbon recovered by burned areas. Back in the 1990s, burned areas removed twice as much CO2 as wildfires emitted. But by 2023, cumulative removals from burned areas now cover only around half of what wildfires have emitted. his one-two punch of more CO2 emitted by wildfire and less of it being removed by post-fire recovery is accelerating the climate impact. And, as we saw earlier, both of these trends are growing worse.”